External corrosion poses a significant risk to infrastructure. Pipelines, specifically, are vulnerable to external corrosion, which can lead to leaks, ruptures, and environmental damage if left unchecked. Understanding Corrosion Rates is essential for assessing structures’ health and predicting their lifespan. Engineers can make informed decisions about pipeline maintenance and replacement strategies by calculating their Remnant Life. This article will delve into the key factors that influence the corrosion rates of buried pipelines and do a deep dive into a corrosion model corrosion engineers used to predict the Future Corrosion Rates of buried pipelines.
Understanding External Corrosion
External corrosion is a gradual process that leads to the deterioration of pipeline metal surfaces. This phenomenon arises from electrochemical reactions influenced by environmental factors such as soil composition, moisture levels, and atmospheric conditions. These elements interact continuously, resulting in oxidation, commonly known as rusting. Over time, this persistent degradation compromises the structural integrity of pipelines, posing significant risks to their strength and operational lifespan.
The corrosion process begins when anodic and cathodic areas form on the metal surface. At the anode, oxidation occurs, causing the metal to lose electrons. These electrons travel through the pipeline, participating in cathodic reactions that produce ions. Ultimately, these ions react with water and oxygen, forming rust and other iron oxide compounds. This creates a vicious cycle of deterioration, accelerating the corrosion process further.
External Corrosion Controlling Factors
Corrosion is a complex phenomenon influenced by multiple factors that dictate its rate of occurrence. The speed of corrosion varies significantly based on environmental conditions, coating properties, and protective measures in place.
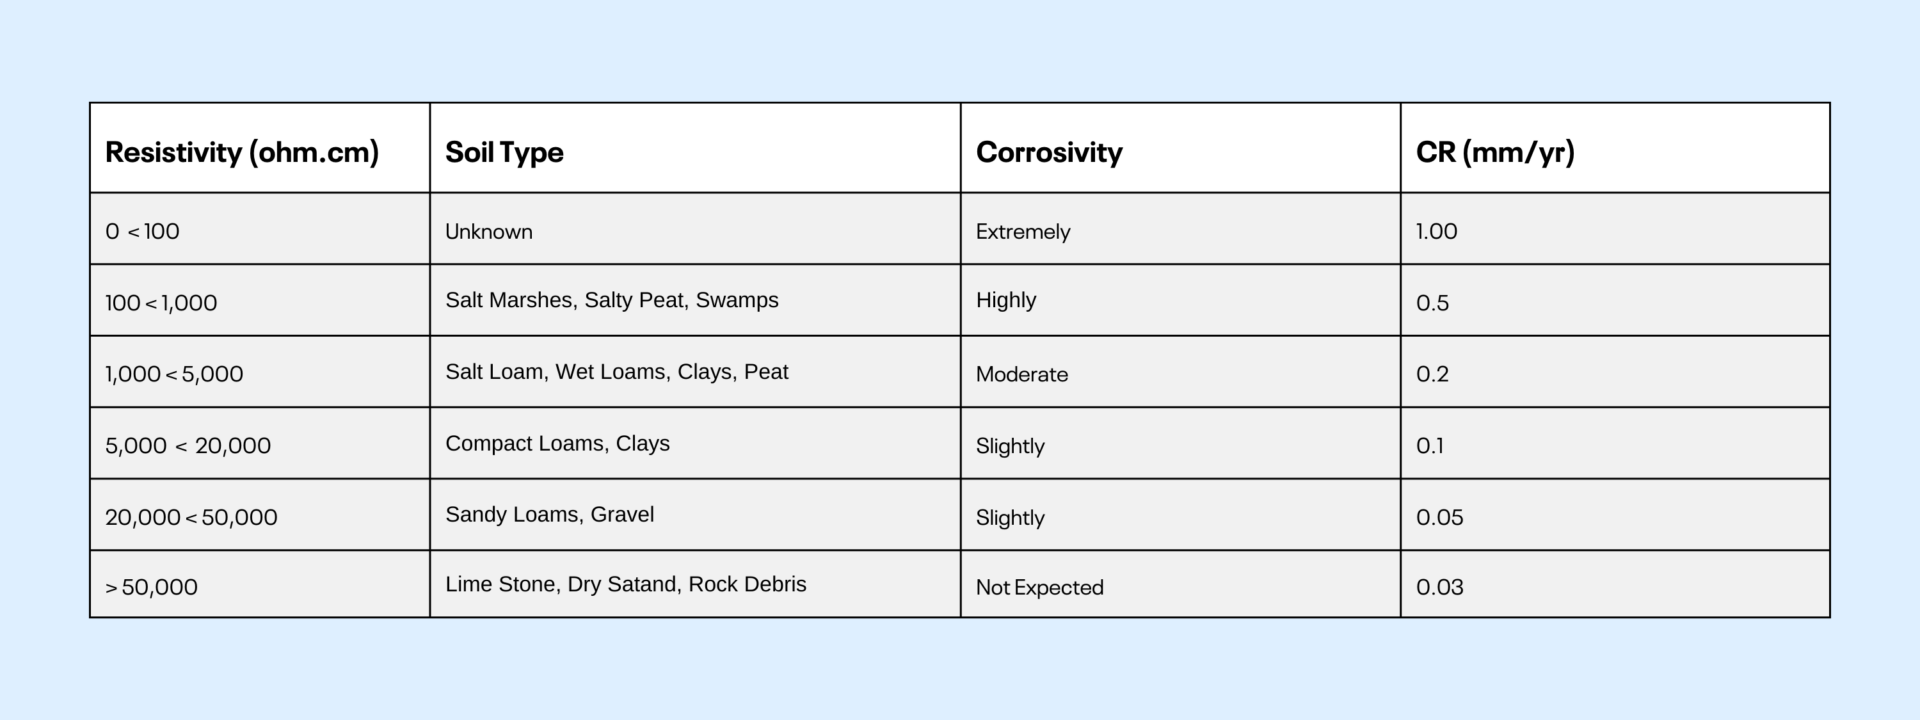
• External Environment (Soil/Water) Corrosivity: Key parameters include moisture content, particle size, soluble salt concentration, oxygen content, and microbial populations. These factors significantly influence the corrosivity of the environment. Typical assessment methods for evaluating the corrosivity of the soil (Base Corrosion Rate) include measuring soil resistivity, pH, and soil redox potential (Eh). For instance, lower resistivity values are associated with higher corrosion rates. Soils with Resistivity below 500 Ω·cm can exhibit corrosion rates ranging from 0.1 to 0.5 mm per year, while soils with resistivity above 2000 Ω·cm generally show much lower Corrosion Rates, often below 0.05 mm per year.

Corrosion Rate table based on the type of Soil – valid for off-shore pipelines
Example:
If our pipe is buried in compact loam with a Resistivity between 5000 and 20000 Ω·cm, its Base Corrosion Rate would be 0.01 mm/year.
• Coatings Protection Effectiveness: The efficiency of protective coatings, such as paints or special layers, is vital for safeguarding metal from corrosion. This Effectiveness is influenced by the Type of Coating, its Age, and Degradation over time. It is essential to assess the Coating Effectiveness for both the main pipe and field joints, taking the lower value to identify the weakest link in the protective system. Regular inspections and surveys ensure these coatings provide adequate protection.
The coating age is calculated by subtracting the installation date from the current date.
Coating Age = Current date – Installation Date
Example:
If the Assessment was performed in January 2016, and the Coating was installed in January 1999, the Coating Age would be 17 years.
To calculate the protection effectiveness for the main pipe and field joint, you can refer to specific tables that categorize coatings into classes based on their type. Each class has associated variables that influence the effectiveness.
Example:
Let’s assume that our pipe’s external coating is “Tape Double Wrap” and the joint coating is “Tape” and the Coating Effectiveness was calculated to be 38%.
• Cathodic Protection (CP) Effectiveness: CP systems mitigate corrosion by applying a negative electrical charge to the metal surface. Their effectiveness depends on factors such as electrical potential and coverage, evaluated through survey techniques like Test Post Potential Surveys and Close Interval Potential Surveys. How the Availability Effectiveness is determined, you can see in the table below:
Availability Effectiveness table showing correlation with CP System Availability
A common target for steel pipelines is to achieve a Potential of -850 mV or more against a copper/copper sulfate reference electrode.
As shown in the table below, there is a direct correlation between the Potential of the Cathodic Protection System and the CP Protection Level Effectiveness.
The CP Protection Level Effectiveness table shows the correlation between CP Potential in Aerobic and Anaerobic conditions and CP Protection Level Effectiveness.
To calculate the Cathodic Protection Effectiveness, you need to multiply the CP Protection Level Effectiveness and CP Availability Effectiveness and divide them by 100.
CP Effectiveness = CP Protection Level Effectiveness / 100 x CP Availability Effectiveness / 100
Example:
If the Potential of the CP system is -850 mV, this yields a CP Protection Level Effectiveness of 100%. If the availability of our CP system is 90%, the CP Availability Effectiveness is 50%. Thus, the calculation would be:
CP Eff = (100 / 100) x (50 / 100) = 0.5
This results in a Cathodic Protection Effectiveness of 50%.
External Corrosion Predictive Model
External corrosion is a stealthy predator, slowly devouring pipeline walls from the outside in, stripping away material, and reducing the wall thickness. If left unchecked, this insidious process can lead to catastrophic structural failures, resulting in leaks, explosions, and environmental disasters.
To proactively tackle corrosion-related challenges, operators are increasingly adopting a data-driven approach that draws on various sources of information. Historical corrosion rates provide a foundational understanding of corrosion progression over time, while Inline Inspections (ILI runs) deliver real-time diagnostics of pipeline health, offering immediate insights into current conditions. At the heart of this strategy lies predictive modeling, which employs advanced algorithms to assess factors such as Environmental Corrosivity, Coating Performance, and Cathodic Protection Effectiveness, allowing operators to forecast future challenges and implement effective mitigation strategies.
While there are various corrosion models available, we will focus on one specific model for calculating the External Corrosion Rate. The equation you can use for this purpose is:
Model External Corrosion Rate = (1 − Eff) × CR Base
Here, CR Base is the soil’s corrosion rate, influenced by environmental factors like moisture content and soil resistivity. The effectiveness of corrosion protection measures, denoted as Eff, is calculated using:
Eff = (1 − Cathodic Protection Effectiveness) × (1 − Coating Protection Effectiveness)
This formula calculates a percentage that reveals the combined strength of our cathodic protection system and protective coatings. This percentage is then multiplied by the soil’s corrosion rate to calculate the external corrosion rate of the model.
Example:
Imagine having the Cathodic Protection Effectiveness sitting at 50% and the Coating Protection Effectiveness at 35%. Now, to find the overall Effectiveness, you can plug these numbers into our formula:
Effectiveness = (1 – 0.5) x (1 – 0.38)
Doing the math, you arrive at an Effectiveness of 0.31, or 31%.
Now, let’s take it a step further and calculate the Model External Corrosion Rate. Using our earlier findings, you apply the formula:
Model External Corrosion Rate = (1 – 0.31) x 0.01
This calculation gives us a Model Corrosion Rate of 0.069 mm/year.
By comparing the corrosion rate from the model with data from other sources, you can forecast Future Corrosion Rates and use them to calculate the Remaining Life of pipeline segments and create effective Inspection plans.
Example:
If Past Corrosion Rates averaged 0.07 mm/year and the model predicts an increase due to changes in environmental conditions, the Future Corrosion Rate might be adjusted to 0.1 mm/year.
Managing and predicting External Corrosion in Pipelines with IMS PLSS
If you are seeking the ultimate tool to manage external corrosion, look no further than IMS PLSS (Integrity Management System Pipeline and Subsea Systems) software. This cutting-edge solution serves as a centralized hub, seamlessly integrating data from various sources, including Inspections, Assessments, and Cathodic Protection Surveys. The External Corrosion Module takes it a step further by incorporating the EXCOR corrosion prediction model, which calculates Model Corrosion Rates based on critical controlling factors. This powerful combination enables operators to forecast future corrosion scenarios by combining historical data with predictive analytics. With IMS PLSS, you can proactively manage pipeline integrity, address external corrosion challenges, and make data-driven predictions on Corrosion Rates to ensure the longevity and reliability of your pipeline systems.
Want to learn more about IMS?
Request a demo below to get a first-hand look at its capabilities!

Denis Tkalec Technical writer
Denis Tkalec is a technical writer at Cenosco, specializing in asset integrity management software since 2022. With a background in education and six years in marketing, she turns complex topics into clear, user-friendly content. Inspired by Camus’s belief that “a writer keeps civilization from destroying itself,” she brings precision and care to every manual.


