Pipelines carry some of the most hazardous substances on the planet — under pressure, often buried, and always aging. When something goes wrong, the consequences extend far beyond a single piece of pipe. Yet in many organizations, the processes that should prevent these failures — corrosion assessments, fitness-for-service evaluations, risk analyses, and repair workflows — are managed in isolation.
“A chain is only as strong as its weakest link.” The same is true for pipeline integrity: managing barriers effectively is only possible when all the processes that feed into them are connected.
This blog explores how pipeline barrier management works in practice, why process integration is essential, and how IMS PLSS supports a fully integrated approach to pipeline and subsea integrity management.
What Is Pipeline Barrier Management?
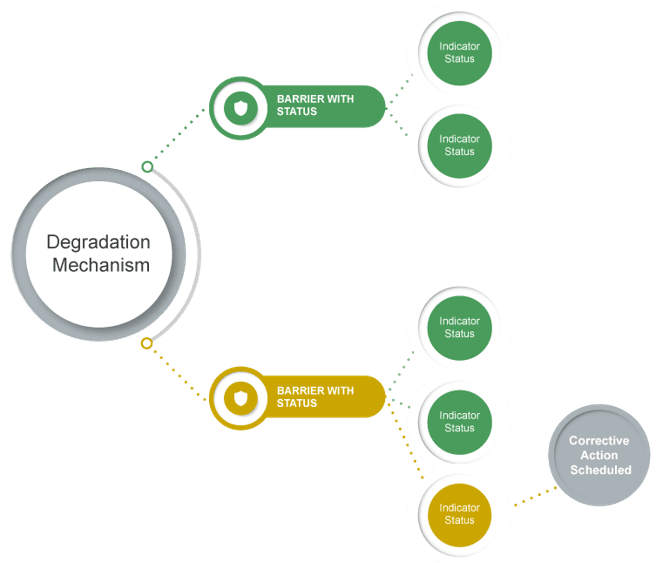
A barrier is a control measure that prevents or mitigates a degradation mechanism from leading to a loss of containment. For example, if internal corrosion is identified as a degradation mechanism for a given pipeline, a barrier might be the corrosion inhibition program that keeps the corrosion rate within safe limits.
Barriers are not static. Their status, whether they are functioning effectively or failing, must be continuously monitored and updated based on inspection findings, process data, and assessment results.
In IMS PLSS, barrier statuses are color-coded:
- GREEN — the barrier is effective
- AMBER — caution, monitoring required
- YELLOW — actions are in place, pending GREEN
- RED — the barrier is compromised; follow-up action required
- BLUE — unknown or no data available
The goal of pipeline barrier management is to keep all barriers GREEN or to act quickly when they are not.
Put simply, pipeline barrier management is the ongoing practice of tracking the status of every barrier across a pipeline’s degradation mechanisms and taking timely action whenever a barrier weakens, so the pipeline never operates outside a safe integrity envelope.
The Business Processes Behind Pipeline Integrity
To understand pipeline barrier management, you first need to understand the key processes that determine barrier status.
Assessing Corrosion and Structural Integrity
The following four processes turn inspection and process data into a risk picture.
Fitness-for-Service (FFS) Assessment
An FFS Assessment evaluates the structural integrity of a pipeline following an In-Line Inspection (ILI) run. The Pipeline Engineer imports Pipe Tally data, calculates the Corrosion Tolerance (CT) and Safe Working Pressure (SWP), and final-approves the Condition History. The CT calculated here feeds directly into the Risk-Based Assessment.
ILI Comparison
ILI Comparison matches defects between two successive ILI runs to calculate short-term corrosion rates. These are then used as input for the Internal and External Corrosion Assessments.
Internal and External Corrosion Assessments
These assessments combine data from multiple sources: ILI runs, coupon, probe, and corrosion inhibition readings for internal corrosion, and Cathodic Protection (CP) surveys, Close Interval Potential Survey (CIPS), Direct Current Voltage Gradient (DCVG), and other data for external corrosion, to determine past and future corrosion rates (CR) and a Confidence Rating. These outputs feed both the Risk-Based Assessment and the Degradation Management workflow, where they are used to update barrier statuses.
Risk-Based Assessment (RBA)
RBA uses the CT from FFS and the CRs and Confidence from the corrosion assessments to calculate Remaining Life (RL), risk, and the Next Inspection Date (NID). It drives inspection scheduling, and when the Remaining Life is short, it can trigger corrective action. The Equipment’s Integrity Status is also updated based on the calculated RL.
General Inspection Management
General Inspection Management covers all PLSS-related inspections except ILI runs, including coupon, probe, and corrosion inhibition readings (for Internal Corrosion Assessment), as well as CP surveys, CIPS, DCVG, and other external inspection activities. When an inspection schedule is due, the Field Inspector performs the work, records findings, and uploads the results. The Pipeline Engineer then reviews and final-approves the data, registers any anomalies, and creates schedules for ongoing monitoring. If issues are identified, the Corrective Action workflow is triggered.
ILI Inspection Management
ILI Inspection Management covers the end-to-end workflow for In-Line Inspection runs. The workflow starts when an ILI schedule is due. The Pipeline Engineer reviews the work scope, a Contractor performs the ILI run, and the Pipeline Engineer converts and imports the Pipe Tally data into IMS PLSS. The imported data is then reviewed and final-approved through the FFS Assessment workflow. Once the Condition History is approved, a new schedule is created for the next ILI run.
Corrective Action Management
Corrective Action Management (also referred to as Anomaly Management) handles the full repair lifecycle: from identifying a defect or a RED barrier, through work order creation and repair execution, to final approval. Once repairs are complete, the barrier status can be updated back to GREEN in the Degradation Management workflow.

Each process produces outputs that the others depend on. Run them independently, and you lose the thread. Connect them, and you get a clear, auditable picture of integrity status across every pipeline system.
You can explore each of these workflows in more detail in the IMS PLSS documentation.
The Degradation Management Framework: Connecting the Processes
The Degradation Management Framework is the backbone of pipeline barrier management in IMS PLSS. It is the structure within which all the processes above operate, and it makes the connections between them visible.
Before the cycle begins, two things need to be in place. First, the asset hierarchy (Site, Plant, Unit, FLOC, and Equipment) must be configured. This is the backbone everything else hangs off. Second, systems must be defined. In PLSS, a system groups pipeline equipment that share the same degradation mechanisms, e.g., internal corrosion, external corrosion, cracking, erosion, and so on.
With the hierarchy and systems in place, the following cycle runs continuously – triggered by a new ILI run, updated assessment results, a change in operating conditions, or simply a reassessment falling due:
1. Identify / Revise Degradation Mechanisms and Descriptions
The Corrosion Engineer and Pipeline Engineer identify or update the degradation mechanisms (DMs) relevant to the pipeline system, along with their descriptions.
2. Identify / Revise Barriers assigned to DMs
For each DM, the relevant barriers (primary and secondary) are identified or revised. Barrier status is determined by the worst indicator, whether from inspection findings, corrosion calculations, IOW exceedances, or other sources.
3. Identify / Revise IOWs and exceedance limits
Integrity Operating Windows are defined or updated for each applicable barrier. IOW exceedances trigger an immediate barrier status change and raise a follow-up action.
4. Update Barrier Statuses and Risks
Barrier statuses are updated based on the latest available data: corrosion rates (CR) from Internal and External Corrosion Assessments, CP, CIPS, DCVG and other data from General Inspection Management, Remaining Life and Risk from the RBA, and repair outcomes from Corrective Action Management.
5. Implement / Revise Monitoring Plan
For barriers related to process control, sampling, or chemical treatment, a monitoring plan is implemented or revised. If an IOW is exceeded, a follow-up action is raised (Step 6).
6. Raise follow-up actions
When an IOW is exceeded, a follow-up action is created to address the exceedance and return the barrier to GREEN. For barriers not related to process control or sampling, the relevant Inspection Management workflow is initiated instead. If a barrier is compromised, Corrective Action Management and the Internal / External Corrosion Assessment workflows are triggered.
The cycle then repeats, with each iteration informed by fresh inspection data, updated assessments, and the outcomes of any corrective actions taken.

A Practical Example: From Data to Barrier Status
Consider a pipeline with three active barriers, Impressed Current, Corrosion Allowance, and Process Control (CO₂), each monitored by its own dedicated schedule.
Schedule 1: CP Test Post-Survey (every 12 months)
The Field Inspector performs the Cathodic Protection survey and records the CP Test Post data in IMS PLSS. If the CP readings fall outside acceptable limits, the associated Impressed Current barrier is flagged RED, and a follow-up action is raised.
Schedule 2: Remaining Life Calculation
This schedule has two parts. Every five years, an ILI run is performed (Schedule 2a) and the data is imported via the FFS Assessment workflow to calculate the Corrosion Tolerance. Every year, an Internal and External Corrosion Assessment is performed (Schedule 2b) to determine the corrosion rate.
The Remaining Life is then calculated as:
Remaining Life = Assessment Date + (Remaining Corrosion Tolerance ÷ Corrosion Rate)
For example: if the assessment date is January 2022, the remaining CT is 0.7 mm, and the corrosion rate is 0.06 mm/year, then:
Remaining Life = January 2022 + (0.7 ÷ 0.06) = July 2033
This result flows directly into the RBA, which updates the risk profile and Next Inspection Date. The associated Corrosion Allowance barrier turns GREEN.
You can estimate your pipeline’s remaining life with the free Pipeline Remaining Life Calculator.
Schedule 3: IOW Monitoring (every day)
When IMS PLSS is connected to a process data system (e.g., PI), process parameters are checked automatically against the defined IOW limits. If a limit is exceeded, the barrier status updates, and the Corrosion Engineer is notified; no manual check isrequired. If there is no exceedance, the Process Control (CO₂) barrier stays GREEN.
After the schedules have been executed and the data reviewed, the Pipeline Engineer approves the results. The approval updates the barrier statuses, adjusts the integrity status of the pipeline system, and creates new schedules for the next cycle.

Why Integration Matters
When these processes are managed separately, in spreadsheets, standalone tools, or different departments, critical information gets lost between steps. A corrosion rate calculated in one system may never make it into the risk assessment. A repair that resolves a RED barrier may not trigger an update to the inspection schedule.
The result is a fragmented picture of integrity status, where decisions are made on incomplete information and the real condition of the pipeline is never fully visible.
Integrated pipeline barrier management changes this. When FFS feeds into RBA, when corrosion assessments update barrier status, and when corrective actions loop back to the degradation management workflow, every decision is made with the full picture in view.
Pipeline integrity management is most effective when executed as an integrated process, and IMS PLSS is built to make that integration practical, auditable, and repeatable.
Discover how connected pipeline barrier management
can work for your organization.
Fill out the form below to get a PLSS demo now!

Elsa Tolsma-de Klerk Technical Writer
Elsa is an engineer with a passion for sharing knowledge. She holds a Master’s in Electronic Engineering and spent over a decade at Sasol as an Advanced Process Control Engineer, where she gained hands-on experience in optimization, control systems, and writing technical documentation. Since 2019, she’s been a Technical Writer at Cenosco, now leading the IMS knowledge base and training Academy team.