Two engineers can look at the same corroding pipe, run two different Risk-Based Inspection methods, and come back with two different inspection dates. That’s the situation integrity teams face when more than one methodology is available to them — and since 2026, Cenosco’s IMS users have exactly that.
Risk-Based Inspection (RBI) prioritizes inspection effort according to how likely a component is to fail, and how bad it would be if it did. API RP 580 sets out the principles. Where methodologies differ is in how much they measure, and how much they leave to judgment.
IMS PEI supports two:
- API RBI 581 — the fully quantitative methodology published by the American Petroleum Institute. It calculates failure probability as a frequency per year, and the consequence in square meters and dollars.
- S-RBI — a methodology originally developed by Shell, compliant with API 580 and built on API 571’s damage mechanisms. It runs either qualitatively or semi-quantitatively. In semi-quantitative mode, it uses calculators and structured questionnaires — including real cost figures — and then expresses the result as a class rather than an absolute number.
Neither of those engineers is wrong.
API RP 580 describes the semi-quantitative middle ground as one that “is geared to obtain the major benefits of the … two approaches (e.g., speed of the qualitative and rigor of the quantitative).”
Which is a polite way of saying: if one method were simply better, nobody would need to choose. We’ve written before about how qualitative, semi-quantitative and fully quantitative RBI each earn their place.
Both are available in IMS, and both are supported. So the question integrity teams now ask us is not “can IMS do 581?” but “which one should we actually run?”
So, how do you go about choosing an RBI methodology? Let’s break it down.
What do S-RBI and API RBI 581 have in common?
More than you might expect — and it changes what choosing an RBI methodology actually costs you.
Both methodologies sit on the same asset hierarchy in IMS: Functional Location (FLOC), Equipment, Components, Corrosion Loops, and their respective specs. The same Corrosion Loop (CL) object holds the Degradation Mechanisms (DMs) and the barriers protecting against them. Integrity Operating Windows (IOWs) work the same way in both. Those are the process limits you monitor to keep a degradation mechanism under control.
Inspection history comes from the same place, too: equipment condition history records and wall thickness calculations. Both methods feed their results into the same inspection schedules, which in turn feed your inspection data management and your CMMS.
So the foundation is shared. You are not choosing between two products or two data models. You are choosing how IMS converts the same asset data into an inspection interval.
That’s the part where they genuinely diverge.
Where do the two methodologies actually diverge?
Three places: how they express probability, how they express consequence, and what they do with time.
Probability: susceptibility levels or failure frequency per year?
S-RBI assesses Susceptibility to Failure (StF) per degradation mechanism, per component. It accounts for corrosion rates, susceptibility factors and levels. The result comes out as None, Low, Medium, or High.
API RBI 581 calculates a Probability of Failure (PoF) as a frequency per year, using Bayesian logic:
PoF = gff × F_MS × D_f(t)
Here, gff is the generic failure frequency (industry failure data, tabulated in API 581 Part 2), F_MS is the Management Systems Factor reflecting the quality of your mechanical integrity program, and D_f(t) is the Damage Factor as a function of time.
The practical difference is precision versus data appetite. A susceptibility level of “High” is a rating your team can defend in a workshop. A failure frequency of 4.30 × 10⁻⁵ per year needs every input behind it.
Worth saying early, though: those four susceptibility categories have defined meanings and documented, mechanism-specific criteria behind them. We come back to that below.
Consequence: a class or square meters and dollars?
S-RBI rates consequence across four categories — Asset, People, Environment, and Community — and takes the highest as the overall consequence. Results are expressed as None, Low, Medium, High, or Extreme.
That sounds less rigorous than it is, and it’s the point most often misread. In semi-quantitative mode, the Asset consequence class is derived from an actual cost estimate. You are working in dollars; IMS just reports which band you landed in. More on that below.
API RBI 581 does something different. It calculates an area consequence for flammable, toxic, and non-flammable, non-toxic releases, expressed in ft² or m². Then it calculates a financial consequence in dollars, covering component damage, lost production, personnel injury, and environmental damage.
Let’s put numbers on that. Take the component we work through later in this article — the shell of vessel V1103 in an amine unit. Carbon steel, 2,447 mm inside diameter, carrying C1–C2 gas at 10 bar and 71 °C, with manual detection and isolation and a foam spray system for mitigation.
Run the API RBI 581 consequence analysis on it, and IMS returns an area consequence of about 164 m² and a financial consequence of around $11 million. S-RBI, assessing the same failure, returns a class.
Both are traceable to money. Only one puts the money on the front page.
Risk: static criticality or risk that grows with time?
This is the difference that changes how you plan.
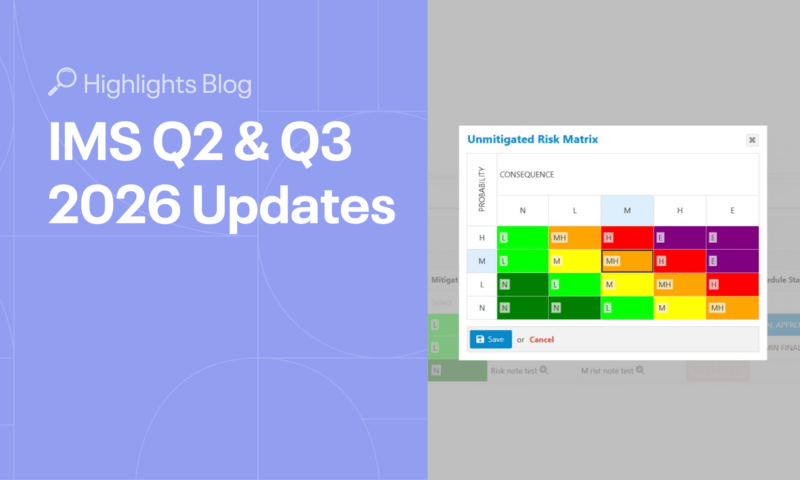
S-RBI calculates Criticality — the base risk, with the effects of inspection and maintenance disregarded. It plots StF against consequence on a Risk Assessment Matrix and returns None, Low, Medium, Medium-High, High, or Extreme. Criticality is static. It describes the component’s inherent risk in its operating context.
API RBI 581 calculates dynamic risk. Risk increases with time because the Damage Factor is a function of age. Results come out as ft²/yr or $/yr, and the curve climbs the longer you leave the component uninspected.

Figure 1 — S-RBI reports a constant base risk. API RBI 581 risk grows with age until it crosses the target, and that crossing sets the next inspection date.
That single distinction drives the interval logic in both methods, as we’ll see below.
So how do the two methods compare, criterion by criterion?
Here is the whole picture in one place. Read it as two columns describing the same job done two ways, rather than a scorecard — most rows are neither better nor worse, just differently expressed.

Is “semi-quantitative” really the lighter option?
Less than people assume, and this is where S-RBI is most often underestimated.
Two things are worth knowing before you treat the category outputs as judgment calls.
The consequence assessment can go deep into finances. In IMS, you answer Asset consequence at one of three levels of detail — Direct, Simple, or Detailed. At the Direct level, you estimate the total cost and pick the class. At the Detailed level, you build it up from production loss, repair costs, and labor, using a production loss equation and labor rates configured once for your site.
Take the same vessel. Production on this unit runs at $328,365 per day. Say a leak takes it down for three days, with $250,000 in repair materials and contractor payments for a shell plate replacement, and $60,000 in craftsmen, operator, and engineering hours:
C_ec = (3 × $328,365) + $250,000 + $60,000
C_ec = $985,095 + $310,000 ≈ $1.30 million
That lands in the 1–10 MUSD band, so the Asset consequence class comes out Medium. Remember the overall consequence is the highest of the four categories, so People, Environment or Community may well govern instead.
Two things are worth noticing. You just did a financial calculation, and the answer came back as a letter — the number is there, traceable and auditable, but the methodology reports the band rather than claiming more precision than the inputs support. And this figure covers asset and production only. Injury and environmental cost sit in their own categories in S-RBI, where API RBI 581 rolls them into a single financial consequence.
The probability assessment has documented criteria per mechanism. The S-RBI susceptibility categories aren’t vague. “High” means a degradation rate over four times the design, with loss of in-service integrity likely. “Medium” means repair or replacement is probable within design life. And the criterion is set per degradation mechanism — corrosion compares actual rate against design rate, creep compares hours, fatigue compares cycles, while non-age-related mechanisms use their own tables and decision trees.
What are the structured questionnaires actually for?
Consistency, mostly. This is the underrated advantage, and it’s the reason the category output holds up.
The questionnaires exist so a team can reach a defensible High, Medium, or Low without a health, safety, and environment (HSE) specialist in the room. They provide guidance and consistency. Rather than asking an inspection engineer to intuit a class, S-RBI asks a sequence of concrete questions and derives the class from the answers. Two engineers assessing similar components in different units therefore land in the same place.
Cenosco documents this in depth. Degradation Modules hold the per-mechanism guidance, and there’s separate documentation for Special Emphasis Components — the cases where the S-RBI approach itself changes, such as bundles, coils, underground piping, deadlegs, injection and mixing points, tanks, and pressure relief devices. Several of those get purpose-built modeling rather than a standard degradation mechanism.
That reframes the comparison usefully. API RBI 581’s rigor is published in the standard, where you can read how the damage factor’s calculations are derived. S-RBI’s rigor lives in the methodology documentation instead. Both are auditable — you just look in different places. So it isn’t a straightforward choice between a calculated method and an intuitive one.
But let’s be honest about the limits. Those questionnaires produce an estimate of one class out of five, with the accuracy that implies. S-RBI is not a Quantitative Risk Assessment method, and it’s a mechanistic procedure, so the team should always review the outcome. Two guardrails follow:
- For high or extreme criticalities, consider a more quantitative consequence assessment method.
- Don’t use S-RBI where the potential consequence sits outside the matrix — Asset consequences above roughly 1,000 MUSD need a dedicated analysis with HSE or Quantitative Risk Assessment (QRA) specialists.
Read that first guardrail again, because it’s really an argument for running both methods.
Why does S-RBI have a Confidence score, and RBI 581 doesn’t?
Because the two methods handle uncertainty in opposite ways.
S-RBI assesses Confidence separately from criticality. It reflects how much you trust your own degradation forecast, based on three key questions: how stable and controllable the DM is, how many reliable inspections you have, and how reliably you monitor process conditions via IOWs. IMS scores each question +0.1, 0 or −0.1, capped at ±0.2, and returns a rating from Very Low to Very High.
Confidence then combines with criticality to produce the Interval Factor (IF). Better confidence means a longer interval. Worse confidence shortens it.
API RBI 581 has no equivalent. Uncertainty is already baked into the PoF — through the management systems factor and through inspection effectiveness, which adjusts the damage factor based on how thoroughly you inspected.
Put simply: S-RBI asks you how much you trust your data and adjusts the interval. RBI 581 assumes the data is what it is and calculates from it.
How does each method arrive at an inspection interval?
Let’s run our earlier component through both.
The component: the shell of vessel V1103 in an amine unit. Carbon steel, 2,447 mm inside diameter, minimum required thickness 8.97 mm, last inspected at 10.16 mm, selected corrosion rate 0.127 mm/yr (ideally this should off course be calculated based on measured data). Last inspection July 2024.
The S-RBI route. First the remaining corrosion allowance:
RCA = 10.16 − 8.97 = 1.19 mm
Then the remnant life:
RL = 1.19 ÷ 0.127 ≈ 9.4 years
Then the interval. Criticality and confidence combine into an Interval Factor, and the Maximum Inspection Interval (MII) is simply that factor applied to the remnant life:
MII = RL × IF
Four inputs, one division, one multiplication, and a defensible team judgement about the factor.
The API RBI 581 route. No division. The same wall thickness and corrosion rate feed a damage factor, which combines with the generic failure frequency and the management systems factor to give a probability of failure as a frequency per year. Consequence comes out as an area in square meters and a figure in dollars. Plot the two together and you have current risk — Medium, for this component.
Then RBI 581 does the thing S-RBI doesn’t. It iterates.
IMS steps the age forward, recalculating risk as the damage factor grows, and watches for the point where risk crosses the target set for the unit. The consequence stays put throughout — only the probability moves.
Those targets depend on how the site is configured. An ISO Risk Plot sets acceptable risk on area and on money. An API RBI Matrix uses a risk target criterion and a probability of failure target. Whichever applies, the first one reached sets the maximum inspection interval.
One more thing governs on top of that , and it applies to both methods. Where a legal or local interval target is shorter than the calculated one — as it was on this vessel — the regulator’s calendar wins, and that becomes the next inspection date.
Same vessel. Same readings. One method divides, the other iterates.
Notice what 581 needed that S-RBI didn’t. On the consequence side: representative fluid and stored phase, production cost per day, population density, injury cost, environmental cost per barrel, process unit replacement cost, outage multiplier, detection and isolation classifications, mitigation system, operating pressure and temperature, equipment mass and inventory mass. On the probability side: yield, tensile and allowable stress, joint efficiency, design pressure, inside diameter, data confidence, velocity, and for the insulated case the insulation type, complexity and condition plus coating grade and installation date. For one component.
What does onboarding each methodology actually cost?
This is where most of the real difference lives, and the comparison table puts it plainly: low to medium effort for S-RBI, high for API RBI 581.
But the cost is not the calculation. IMS does the calculation either way. The cost is the data.
An S-RBI assessment runs on corrosion rates, thickness readings, a credible failure scenario, and questionnaire answers on susceptibility and consequence. As we saw above, those answers can involve real cost figures — so S-RBI isn’t effort-free, and the detailed levels take real time. An RBI 581 assessment runs on all of that plus fluid properties, inventory masses, detection and isolation classifications, financial parameters, material stress values and insulation condition — per component.
The difference is that S-RBI lets you choose your depth. You can answer Asset consequence at the Direct level on low-criticality components and go Detailed where it matters. RBI 581 has no equivalent dial.
Because 581 is quantitative, missing data doesn’t produce a vaguer answer. It produces no answer. In IMS, the Calculate button stays disabled until every required input is filled.
That’s not a criticism of the method. It’s the honest price of precision, and the biggest predictor of whether a 581 rollout lands on schedule. So choosing an RBI methodology comes down less to rigor than to what your data can feed.
There is one more input that isn’t data at all. API 581 does not define the risk target — your organization does. Every interval the method produces rests on a number someone has to agree. Getting that agreement is often slower than gathering the data.
When is S-RBI the right choice?
So, now we know what each method measures and what each costs to run. That’s the substance of choosing an RBI methodology — so which one fits your plant?
S-RBI tends to fit when:
- You are standing up an RBI program for the first time and need plant-wide coverage quickly.
- Data quality varies across units, and forcing quantitative inputs would mean guessing.
- The people who own the result — plant inspection engineers, operations engineers — need to fully understand the methodology to defend it.
- Your assessment team has no dedicated HSE or QRA specialist, and you want the structured questionnaires to carry the consistency.
- Your degradation mechanisms include non-age-related or strategy-based DMs, which 581’s damage factors don’t map cleanly onto.
- You want a visible Confidence rating that lengthens or shortens the interval, rather than uncertainty folded into the probability calculation.
- You want to vary the depth of assessment across a unit — Direct on low-criticality components, Detailed where the consequence is significant.
- You prefer to express susceptibility, consequence and risk as broad categories rather than absolute numbers.
The two points about your people (numbers three and four) matter more than they look. A method nobody in the room can explain in a workshop can increase equipment risk rather than reduce it.
When does API RBI 581 earn the extra effort?
API RBI 581 tends to fit when:
- Corrosion and inspection data are mature, complete and trusted.
- Your organization has already agreed what risk it will accept, and you want the assessment to work from that number.
- The dominant mechanisms are thinning, stress corrosion cracking (SCC), external damage or the others covered by the 20 damage factors.
- Criticality comes out High or Extreme — where the S-RBI methodology itself recommends considering a more quantitative consequence assessment.
- You need risk in financial terms to justify inspection or replacement budgets.
- You want dynamic risk — as the component ages the damage factor grows, so risk climbs. That gives you a curve you can point at to show what deferring an inspection costs.
- A regulator, insurer or joint-venture partner expects a fully quantitative assessment.
- You are considering dynamic RBI — feeding live inspection or process data into the assessment, or building AI-assisted recommendations on a continuously updating risk number.
That criticality point (number 4) deserves weight. A five-band consequence class is a sensible tool across a plant. It is a blunt one when a single component could cost tens of millions.
The financial output is often the deciding factor too. A target of $70,000 per year is a number a budget holder can argue with you about. “Medium” isn’t.
Can you run both methodologies in one IMS site?
So, we have two methods, two sets of strengths, and one plant. Do you actually have to pick?
Not really. For most sites, running both is the sensible answer.
RBI 581 can be enabled per site in IMS. Methodology is then chosen per equipment. So you can run S-RBI across the bulk of your equipment for coverage and speed, and reserve RBI 581 for the ones where quantitative rigor pays: high-consequence circuits, equipment facing a regulatory challenge, or assets where a deferral decision carries real money.
Both write back to the same inspection schedules and the same condition history feedback loop, part of the wider degradation management cycle. When an inspection is executed, findings update the condition history, inspection effectiveness can be overridden based on actual coverage, and the analysis can be set back to draft and revised. That loop is identical for both methods.
A staged approach also works well. Run a faster S-RBI pass to find the high-risk facilities, then apply 581 only to those. You get quantitative rigor where it changes a decision, without paying for it everywhere.
Choosing an RBI methodology: a short checklist
To reiterate the whole argument in one place:
- Audit your data first. List what 581 requires per component and check honestly what you hold.
- Map your dominant degradation mechanisms against the 20 damage factors. Note the gaps.
- Ask who has to defend the result, and whether they’ll understand the method.
- Confirm whether anyone external requires a quantitative assessment.
- Decide whether you need risk expressed in dollars.
- If you go with S-RBI, choose your consequence depth per criticality — Direct, Simple or Detailed — rather than defaulting to one level everywhere.
- Set your risk targets. API 581 doesn’t define them — that input is yours.
- Segment: S-RBI for breadth, 581 where rigor changes a decision or where criticality comes out High or Extreme.
Want to see both methods on your own data?
If you’re choosing an RBI methodology — or already running S-RBI and wondering whether API RBI 581 is worth the data effort — we’re happy to walk through both on your own equipment data.
Request a demo of IMS PEI and we’ll show you the same component assessed both ways, so you can see exactly what each method asks for and what it gives back.
Ready for a Demo?
Are you ready to see the IMS in action? Fill out the form below to book a demo!

Elsa Tolsma-de Klerk Technical Writer
Elsa is an engineer with a passion for sharing knowledge. She holds a Master’s in Electronic Engineering and spent over a decade at Sasol as an Advanced Process Control Engineer, where she gained hands-on experience in optimization, control systems, and writing technical documentation. Since 2019, she’s been a Technical Writer at Cenosco, now leading the IMS knowledge base and training Academy team.