API 581, developed by the American Petroleum Institute (API), is a pivotal standard in Risk-Based Inspections (RBI).
It provides a quantitative methodology for crafting inspection plans tailored to the risk associated with each equipment piece and its components.
This approach applies to various pressurized fixed equipment types, including pressure vessels, piping, tankage, pressure relief devices (PRDs), and heat exchanger tube bundles.
Before we delve deeper into API 581, let’s distinguish it from API 580: API 580 sets forth the general principles and minimum guidelines for RBI.
On the other hand, API 581 goes a step further by providing precise quantitative methods for formulating an inspection plan. In this article, we will explore the calculation methods of API 581 in more detail.
The API 581 Risk calculation
The API 581 risk calculation involves two main components:
- Probability of Failure (POF): This is determined by analyzing the likelihood of equipment failure. It considers factors such as material properties, operating conditions, and damage mechanisms.
- Consequence of Failure (COF): This is assessed by considering the potential impacts of equipment failure, including safety risks, environmental damage, and financial loss.
Risk is the Probability of Failure (POF) combined with the Consequence of Failure (COF):
Risk = POF x COF
The API 581 standard is segmented into various parts. Part 2 focuses on determining the Probability of Failure in an API RBI Assessment, while Part 3 delves into conducting a Consequence Analysis in an API RBI Assessment. Let’s explore the details outlined in the standard.
API 581 – Probability of failure (POF) methodology
API 581 Part 2 focuses on the calculation of the Probability of Failure (POF). Two methods are recommended:
- The GFF Method: The Generic Failure Frequency (GFF) method predicts the Probability of Failure (POF) for loss of containment from pressure boundary equipment. It adjusts generic industry failure data to suit specific equipment by incorporating a Damage Factor (DF) and Management System Factor (FMS).
- The Two-parameter Weibull Distribution Method: The Weibull distribution method is employed to forecast the Probability of Failure (POF) for Pressure Relief Devices (PRDs) and heat exchanger bundles. This method utilizes the Weibull statistical distribution, along with scale and shape parameters, to provide the exponential representation of POF over a specified time period.
The GFF Method
Let’s elaborate a bit on the more commonly used GFF Method. The GFF formula determines the chance of an equipment item failing due to a specific type of damage:
Pf(t) = gff * FMS * Df(t)
where:
- Pf(t) is the Probability of failure (POF) as a function of time;
- gff is the generic failure frequency;
- FMS is the Management System Factor; and
- Df(t) is the overall Damage Factor as a function of time.
The Generic Failure Frequency (GFF)
The Generic Failure Frequency (GFF) is set at a value representative of refining & petrochemical industry’s failure data. These GFFs are tabulated in API 581, Part-2 Table 3.1. Four-hole sizes are used to model release scenarios (from a small leak to a rupture) and the error rate is set between 3% to 10%.
The management system factor (FMS)
The Management System Factor (FMS) accounts for the likelihood of detecting accumulating damage leading to containment loss before it becomes critical. It correlates directly with the effectiveness of a facility’s mechanical integrity program and is uniformly applied to all components within the facility. Factors such as inspection quality, corrosion management effectiveness, and adherence to appropriate materials and design codes are taken into consideration. Determining the FMS usually involves a structured assessment, which may include a questionnaire or scoring system.
The Damage Factor (DF)
The basic function of the Damage Factor (DF) is to statistically evaluate the amount of damage that may be present as a function of time in service and the effectiveness of the inspection activity to quantify that damage. The DF is determined based on things like:
- Applicable damage mechanisms;
- Materials of construction;
- Process service;
- The physical condition of the component; and
- Inspection techniques (and frequency) used to quantify the damage.
API 581 provides DFs for the following eight mechanisms:
- Thinning (both general and local);
- Component lining damage;
- External damage (thinning and cracking);
- Stress corrosion cracking (SCC);
- High-temperature hydrogen attack (HTHA);
- Mechanical fatigue (piping only);
- Brittle fracture, including low-temperature brittle fracture, low alloy embrittlement, 885 °F embrittlement; and
- Sigma phase embrittlement.
In the API 581 standard, you’ll find detailed instructions for carrying out each of these DF calculations. Typically, a multitude of input parameters are needed for a single damage factor calculation.
API 581 – Consequence of failure (COF) methodology
Part 3 of the API 581 standard presents techniques for calculating the Consequence of Failure (COF), offering two methods:
- Level 1: Utilizes predefined variables for commonly encountered fluids.
- Level 2: A more rigorous approach suitable for any fluid stream composition.
Level 1 relies on equations with a set of well-known variables tailored for typical fluids found in refinery and petrochemical units. It suits situations where the fluid composition is known and falls within standard parameters.
Level 2, on the other hand, offers a thorough analysis of complex or undefined fluid compositions. It allows for a more detailed assessment by considering additional variables compared to Level 1. Note that the COF calculation is independent of the Damage Factor.
Level 1 COF method
Let’s take a closer look at the Level 1 method, which is most used. Here reference fluids are provided within API 581. The reference fluid closest in boiling point and molecular weight to the substance in question should be selected for assessment.
API 581 quantifies the consequences of containment loss in terms of:
- Affected impact area; and
- Financial terms.
Affected impact area consequence
The affected impact area assesses flammable, toxic, and non-flammable & non-toxic consequences, and accounts for both the component damage consequence area and the personnel injury consequence area.
Financial consequence
The Financial consequence accounts for cost due to: Component damage; Lost production; Personnel injury (or) fatalities; and Environmental damage.
Level 1 COF calculation steps
Implementing the Level 1 Consequence of Failure (COF) in API 581 involves the following steps:
- Estimate the release rate.
- Calculate inventory release.
- Identify release type (continuous or instantaneous).
- Assess leak detection and isolation systems.
- Adjust the release rate and mass.
- Estimate the consequence area.
- Assess financial consequences.
You can find comprehensive guidance on executing each of these calculations in the API 581 standard.
The API 581 Outcome
The output of an API 581 RBI assessment is the inspection frequencies or intervals; the scope of work; and priorities. Let’s see how we come to this result.
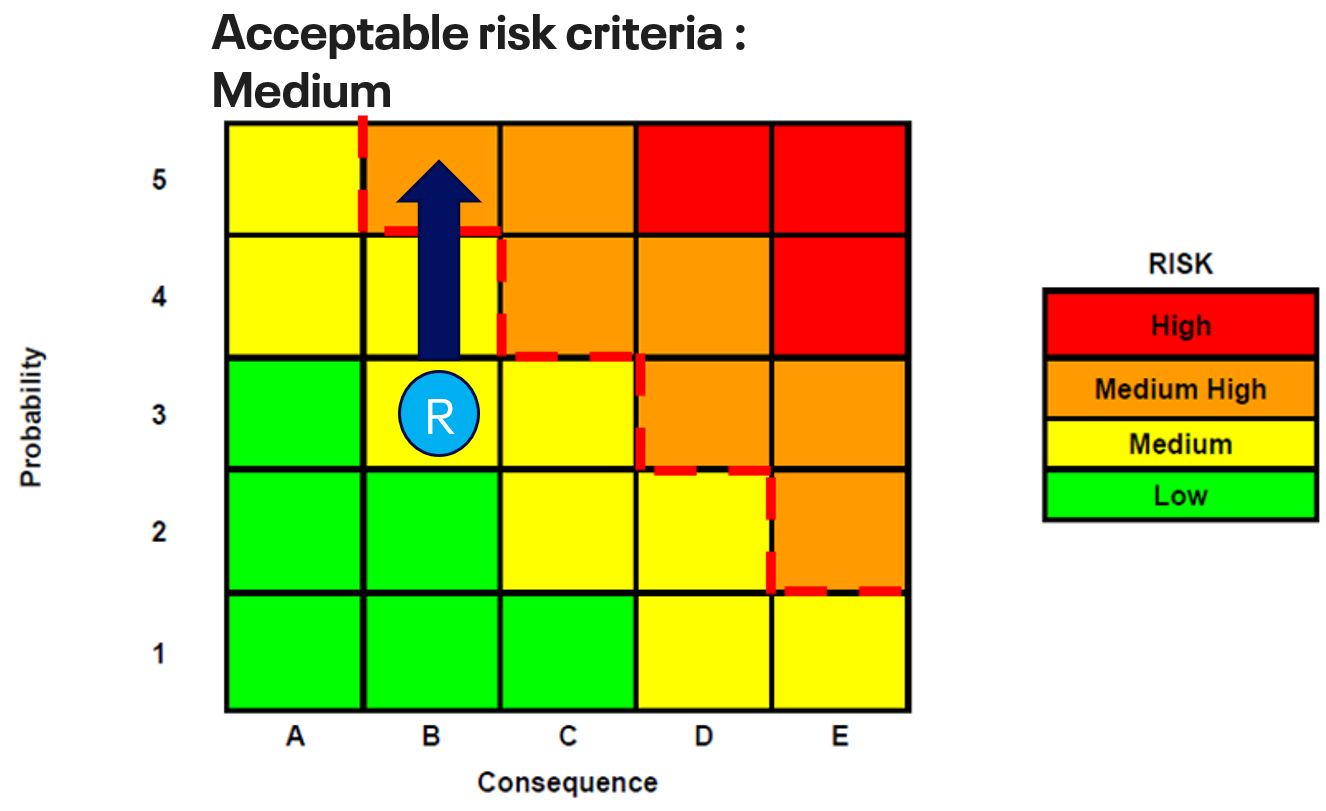
API 581 utilizes risk matrices to visualize and prioritize the risks linked to various equipment pieces. A risk matrix is a simple graphical tool that illustrates an asset’s risk profile.
Typically, it’s a plot with the Probability of Failure (POF) on one side and the Consequence of Failure (COF) on the other. Each cell in the matrix represents a distinct combination of POF and COF, signifying a unique risk level.
This matrix helps identify equipment with high-risk levels needing urgent attention and those with low-risk levels that can undergo less frequent inspections.
The POF and COF calculations result in a POF category (1, 2, 3, 4, or 5) and a COF category (A, B, C, D, or E), based on predetermined ranges outlined in the API 581 standard. These two categories are plotted on the risk matrix (as depicted with the blue “R” in the image below).
In addition, a target risk criterion, such as “Medium” (as illustrated in the image below), needs to be set.
Take note that the target risk criterion is not defined in API 581, allowing your company to define it independently. Subsequent iterative calculations (by increasing the age) are performed to determine when the target risk is exceeded (indicated by the blue arrow in the image below). From this the maximum inspection interval and the next inspection date is identified.

In the end, API 581 calculations lead to a detailed inspection plan tailored to the risk of each equipment piece.
This plan details when (next inspection date) and how (inspection methods and coverage) to inspect. API 581 risk calculations help identify and measure risks for all covered equipment, providing a clear understanding of risks and how to manage them, ultimately reducing risks in processing facilities.
IMS PEI: Empowering Integrated Risk-Based Inspection Solutions
In conclusion, our IMS (PEI) software offers robust support for API 581-based RBI for pressure equipment such as piping, pressure vessels, and tanks. While we do not currently support API 581 for PRVs or bundle exchangers, our capabilities are designed to be flexible, powerful, and compliant with industry standards.
Our current implementation adheres to the 2016 edition, including the 2019 and 2020 addenda – providing a proven and mature framework that many of our clients already trust.
Our solution includes (but is not limited to) the following capabilities:
- 20+ damage factor calculations
- Configurable generic failure frequencies
- Probability and consequence of failure assessments
- Customizable inspection effectiveness criteria
- Risk and interval target configuration
- Integration of RBI outputs into inspection schedules and maintenance plans
- Degradation management with DMs (from API 571) linked to API 581 damage factors, updating barriers and linking IOWs
If you’re reviewing your RBI strategy or considering how to apply API 581 in a practical, scalable way, we’re here to support you. API 581 may not always be the optimal choice for every scenario – which is why we also offer the S-RBI methodology as an alternative. Together, we can identify the RBI approach that best fits your needs – whether it’s qualitative, semi-quantitative, or fully quantitative.
Reach out to us today to start the conversation.
Want to learn more about IMS?
Request a demo below to get a first-hand look at its capabilities!

Elsa Tolsma-de Klerk Technical Writer
Elsa is an engineer with a passion for sharing knowledge. She holds a Master’s in Electronic Engineering and spent over a decade at Sasol as an Advanced Process Control Engineer, where she gained hands-on experience in optimization, control systems, and writing technical documentation. Since 2019, she’s been a Technical Writer at Cenosco, now leading the IMS knowledge base and training Academy team.


