The term P-F curve may sound like something Captain Picard would encounter during his voyages in the Star Trek TV series. In reality, it is more like a crystal ball that gives you insights into the future of your assets. Humor aside, the P-F curve is a powerful tool for asset reliability management and failure prediction. Although every piece of equipment will eventually inevitably fail, with the P-F curve you can maximize the usage that can be gained from it. The P-F curve will help you identify when your assets are likely to fail, allowing you to take preventive measures before it’s too late.
In this article, we will explore the P-F curve in more detail, including its definition, use cases, benefits, and limitations. We will also discuss how to harness the power of the P-F curve for improved asset reliability and maintenance planning.
What is the P-F Curve?
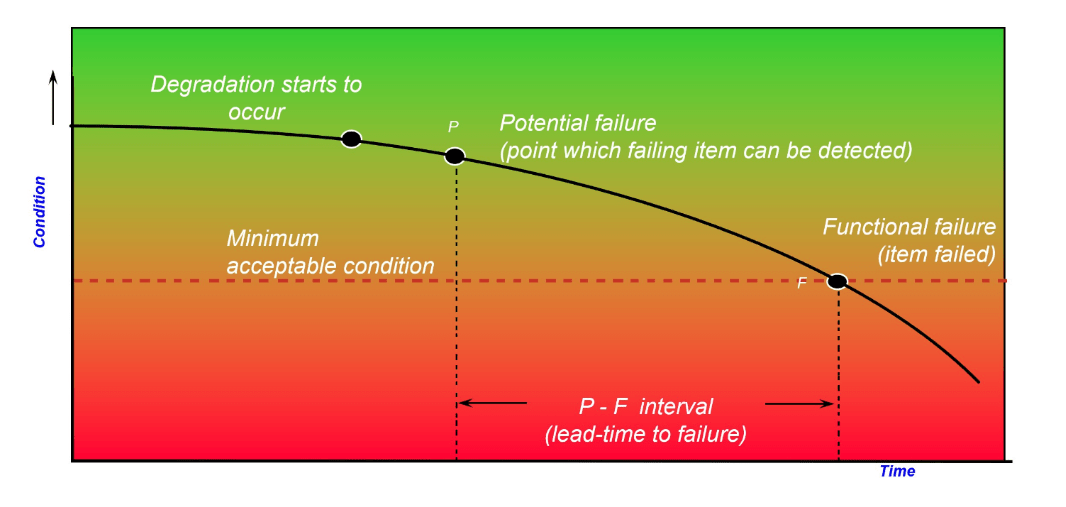
The P-F curve, also known as the Prevention-Failure curve, is a graphical representation that illustrates the condition of equipment over time. It allows you to predict and prevent asset failures by identifying the time (P-F interval) it will take for the asset to experience a functional failure from the initial detection of the potential failure condition. Let’s further explain each of the terms just mentioned:
- Potential failure refers to the initial indication of equipment deterioration or deviation from normal operating conditions. It serves as a warning sign, indicating the need for initiative-taking maintenance measures to prevent functional failure.
- Functional failure represents the point at which the equipment has reached its maximum utility and can no longer perform its intended function.
- The P-F interval is the time between the two points mentioned above. It is the time that goes by from when the potential failure is initially noticed until the actual failure of the equipment occurs.
What does the P-F curve look like?
The P-F curve is a graph where the X-axis represents the progression of time, while the Y-axis represents the functional state or performance of the equipment or asset. The graph begins by determining a minimum acceptable condition for an asset. That is the lowest level of performance allowed for that asset to still function as designed. As time passes, its performance gradually reduces.
Let’s say a manufacturing company has a conveyor belt system that transports products from one end of the factory to the other. During a routine inspection, a technician notices that the conveyor belt system is vibrating more than usual. This vibration is a sign of potential failure, indicating that the system’s components may be deteriorating or reaching the end of their serviceable life. That moment is represented in the curve by the P-point, which stands for “potential failure”. It is a warning sign that maintenance should be scheduled soon. The moment when the failure is predicted to happen is represented by the F-point, which stands for “functional failure.”
A longer interval between the P-point and the F-point gives you more time to fix the issue before the failure happens. At the P-point, you can start planning, and you have time to prepare and do the repair before it comes to the F-point.

Where to find data for building P-F curves?
Identifying the P and F points accurately is crucial for building an effective P-F curve. However, the question remains: where does the information for building it come from?
Several sources of data can be used to accurately predict equipment failure:
- Historical data is one of the most common sources of data for P-F curves. By monitoring the equipment over time and recording the time it takes for each component to fail, you can gather data on one piece of equipment and then apply this knowledge to other similar equipment.
- Equipment specs sheets: Equipment manufacturers often provide information on the expected lifespan of their products, which can also be used to create a P-F curve for that equipment.
- Expert knowledge: Experienced technicians or engineers may know how long certain components are expected to last based on their experience working with similar equipment.
- Sensor data can be used to monitor the health of equipment in real-time, which can also be used to create a P-F curve for that equipment.
By using these sources of data, maintenance professionals can build accurate P-F curves that can be used to proactively schedule preventive maintenance, prioritize critical assets, and improve overall reliability. To maximize the effectiveness of P-F curves, it is important to use reliable data, update the curve as new data becomes available, and use them in conjunction with other tools and techniques for maintenance planning.
Understanding the P-F curve
To understand the P-F curve better, let’s talk about how it can be applied in real life. Take the example of a smartphone experiencing performance issues due to low storage space.
First, we have the potential failure P- point. This is when we start to notice that our phone is slowing down, lagging, or becoming unresponsive.
Then we have the functional failure F- point. This is when our phone has reached its limit and is no longer operational. It is like when your phone freezes, and you cannot even use it anymore. What a bummer!
And then there is the P-F interval. This is the time between your phone first getting slow and freezing, and we can extend it by implementing maintenance best practices. We can regularly delete unnecessary files, remove unused apps, and clear cache and temporary files. Suddenly, you have more space, and everything runs smoother.
And finally, we have condition monitoring techniques. These can include checking the available storage space, monitoring the device’s performance, and running diagnostic tests to find potential issues.
However, the frequency of maintenance will depend on the P-F interval. If we know this interval, we will know how often to do maintenance. If not, we may not delete files often enough, and this could lead to failure much sooner.
So, there you have it, the P-F curve in action.
How to use the P-F curve?
The goal of the P-F curve is to extend the P-F interval cost-effectively. If the P-F interval is three months, you have three months to act between the P and the F. If you only conduct vibration or condition monitoring once a year, you will miss the entire P-F curve. To prevent this, you should perform preventive maintenance and condition monitoring every half of the P-F curve, which is every six weeks.
If you want to be even more thorough, you can conduct condition monitoring on one-third of the P-F curve, meaning every month. However, keep in mind that monitoring every month requires more vibration monitoring measurements and fieldwork to measure the vibration.
Benefits and flaws of the P-F curve for asset reliability management and failure prediction
As we have already seen, using the P-F curve in asset reliability management and maintenance provides numerous advantages. Here is a list of the most important ones:
- It allows you to find the best balance between different strategies, figuring out when predictive maintenance and other maintenance strategies should be implemented.
- The curve also enables correct prediction of an asset’s failure timeframe, allowing for proactive scheduling of preventive maintenance, reducing unexpected breakdowns, and ensuring continuous operations.
- By understanding the P-F curve, you can strike a balance between various maintenance strategies and ensure efficient resource allocation and cost-effective maintenance practices.
- Addressing potential failures shown by the P-F curve proactively contributes to enhanced asset reliability. By taking preventive measures based on the curve’s indications, you can ensure continuous operations, minimize disruptions, and reduce downtime. This leads to improved productivity and customer satisfaction.
However, the P-F curve has some limitations.
- One of the flaws is that it relies on historical data, which may not supply a correct representation of current or future operating conditions. As a result, the predictions obtained from these curves can be inaccurate, leading to ineffective maintenance planning.
- Although reliable in predicting gradual wear and tear failures, the P-F curve may not be as effective in detecting sudden or catastrophic events that can result in asset failure.
- Lastly, the P-F curve is most effective for examining individual assets or components. In situations involving complex systems, it may be necessary to employ a more comprehensive approach, such as a failure mode and effects analysis (FMEA), to identify and address potential failure modes.
In conclusion, the P-F curve is a valuable tool for predicting and preventing asset failures, improving asset reliability, and optimizing maintenance strategies. However, it has some limitations that need to be considered when using it for maintenance planning.
Optimizing Asset Reliability Management with IMS RCM
Cenosco’s IMS (Integrity Management System) software suite includes the RCM (Reliability Centered Maintenance) software. IMS RCM helps optimize your maintenance strategy by preventing unplanned failure and improving asset availability through maintenance. This software can be used together with knowledge of the P-F curve to identify the optimal maintenance strategy for each asset. IMS RCM can help you determine the best time to perform maintenance on an asset to prevent it from failing. This approach ensures that maintenance is performed only when necessary, reducing costs and increasing asset availability.
In the IMS RCM tool, you can plan condition-based maintenance or time-based maintenance. If you want to do condition-based maintenance, you need to think about what kind of condition monitoring to do and at which interval. Therefore, it is essential to estimate the P-F curve, making the P-F curve a valuable tool for asset reliability management and failure prediction.
IMS RCM also provides access to an exclusive library of maintenance models, allowing users to create a cost-effective maintenance strategy in a single step.
In addition, IMS RCM calculates the Maintenance Efficiency Index (MEI) on each asset, using a guided 7-step approach to the RCM2 method. The MEI is a simple metric with which you can decide if the benefit of performing the maintenance plan outweighs its costs. By using the MEI in conjunction with the P-F curve, IMS RCM can help optimize maintenance tasks and improve asset reliability.
Contact Us
Want to learn more about our RCM software? Fill out the form below.

Denis Tkalec Technical writer
Denis Tkalec is a technical writer at Cenosco, specializing in asset integrity management software since 2022. With a background in education and six years in marketing, she turns complex topics into clear, user-friendly content. Inspired by Camus’s belief that “a writer keeps civilization from destroying itself,” she brings precision and care to every manual.


