Developing a risk management strategy is a complex task for organizations due to several reasons, including the complexity of the risk environment, uncertainty, ambiguity, costs, difficulty in reaching consensus, and lack of prioritization.
However, there are tools and methods that organizations can use to overcome these challenges.
One such tool is the bowtie diagram, which is a simple, visual method for risk assessment that can give organizations a snapshot of threats, top events, hazards, consequences, risks, barriers, and their relations in a single diagram while, at the same time, maintaining the integrity of barriers.
Although it is designed to handle complex analyses, the power and beauty of the bowtie diagram lie in the simplicity of its visual format. This makes it easy to communicate and understand critical information about threats, top events, hazards, barriers, and accident risks.
Its clear visual representation of all the essential elements of risk management, from root causes to consequences, impacts, and risk controls and mitigations, allows you to make informed decisions to improve safety and protect the interests of your organization.
In this blog post, we will explore the world of bowtie analysis, investigating its uses, advantages, and potential disadvantages. So, are you ready to take your risk management process to the next level with bowtie analysis? Here are the five things you need to know.
1. Bowtie Analysis: What is it?
Bowtie analysis is a barrier-based risk management tool that uses a visual diagram to identify, analyze, and manage high-risk accident scenarios. It provides an overview of accident scenarios and the barriers put in place to either prevent them from happening or mitigate the consequences.
Specific to one hazard only, the bowtie method helps manage both the accident risks and the barriers by identifying which barriers are more critical.
Bowtie diagrams are created for major accident hazards, as not all hazards are equal in terms of their potential accident impact.
That is why, before you begin making your bowtie diagrams, major accident hazards must be identified.
This identification is done by performing PHA (Process Hazard Analysis) studies such as HAZID (Hazard Identification), HAZOP (Hazard and Operability), LOPA (Layers of Protection Analysis), etc., and preparing the major accident hazards list based on the findings of those earlier studies.
By prioritizing and focusing on the risks that matter most to your organization, you can distribute resources effectively and address critical areas of concern.
2. What does a Bowtie diagram look like?
The name “bowtie” derives from the shape of the diagram, which resembles that traditional type of necktie.
It is divided into three parts: the left side, the right side, and the center. The left side of the bowtie represents the causes of the top event, while the right side represents the consequences.
The center of the bowtie represents the top event itself. The left and right sides of the bowtie are larger than the center because many causes can lead to a top event, while a top event can have many consequences.

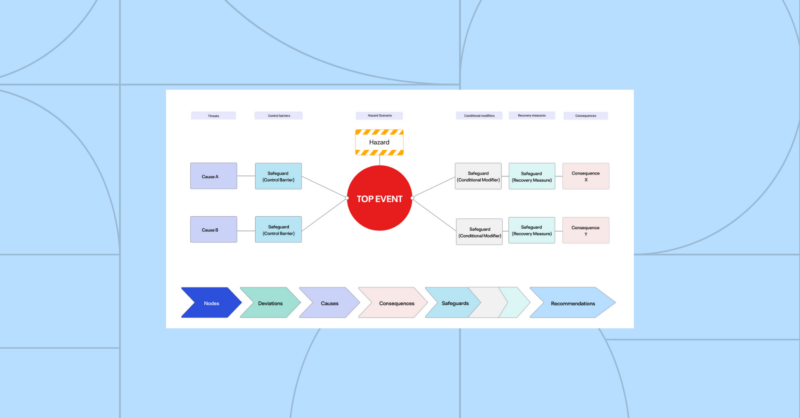
The bowtie diagram includes the following components:
- Left side:
- Threats: The potential causes of the top event.
- Preventive Controls/Control Barriers: The measures put in place to prevent the threats from causing the top event.
- Center:
- Hazard: The potential source of danger or harm.
- Top Event: Event that leads to the loss of control of the hazard.
- Right side:
- Condition Modifiers: Conditions that reduce the probability of occurrence of the final consequences.
- Recovery Measures / Mitigating Barriers: The measures put in place to mitigate the consequences if the top event and hazard occurs.
- Consequences: The potential outcomes of the top event and hazard. The eventual impact on people, assets, community, and environment.
Let’s illustrate the concept of a bowtie method using a relatable real-life situation. Imagine you’re a chef cooking in a restaurant kitchen. You know that cooking involves various accident risks like a kitchen fire.
To effectively manage this risk, you can use the bowtie method. Here’s how it works in the context of fire safety in the kitchen:
- Hazard: The gas used in the cooking process itself is a hazard, which can potentially lead to a fire consequence.
- Threats: These are the potential causes of the fire, such as gas leaks from the stove, or the burner running without flame due to malfunction, or leaving the gas stove unattended.
- Preventative Controls/Control Barriers: Measures put in place to prevent the threats from causing a fire, like installing flame sensors.
- Top Event: The top event is the point where the gas release becomes a disaster if left uncontrolled.
- Condition Modifiers: The probability of ignition is a condition modifier and the presence of ignition sources, such as open flames or sparks, increases the probability of ignition, while the absence or effective control of these sources reduces the probability of ignition.
- Recovery Measures/Mitigating Barriers: Measures to mitigate the consequences of a fire, if it occurs, such as having fire extinguishers, gas and/or smoke alarms, or staff trained in emergency procedures.
- Consequences: The potential outcomes of a fire, including property damage, injuries, or even loss of life.
Request a Demo
Looking for software with Bowtie Visualization? Request a demo today to get started.
Request Now
3. Why a Bowtie workshop is a clever idea
Conduct a Bowtie workshop to enhance the Bowtie analysis process.
It all starts with leveraging existing data on risks and barriers to create a visual representation of threats, hazards, consequences, risks, and barriers.
Prior to the Bowtie workshop, the facilitator and scribe will prepopulate draft Bowtie diagrams with the findings from previous PHA studies.
Then, the facilitator, scribe, and different stakeholders take part in a meeting to discuss and identify additional threats, consequences, and barriers. This collaborative workshop provides an opportunity for different stakeholders to contribute their expertise and insights to the analysis process, ensuring that all relevant risks and barriers are considered.
During the workshop, a series of meetings are held to review, complete and refine the draft bowties until they are approved. This iterative process ensures a thorough analysis of the risks involved and allows for comprehensive risk management.
4. How Bowtie Analysis Revolutionized Industry Incident Understanding
The Bowtie method was crucial in understanding and managing the causes and consequences of accidents like the Piper Alpha disaster and the Deepwater Horizon oil spill.
Piper Alpha was an oil production platform that exploded in 1988, resulting in the loss of 167 lives. After the disaster, the Bowtie method was used to analyze the causes and consequences of the accident, highlighting the potential factors that contributed to the disaster, such as equipment failure, inadequate maintenance, and communication breakdowns.
The Bowtie diagram helped investigators identify the critical control measures and mitigating barriers lacking or ineffective in preventing the incident. That led to significant improvements in safety practices and regulations in the offshore oil and gas industry.
5. The Advantages and Disadvantages of Bowtie Analysis
The bowtie analysis is more than a risk assessment tool used by safety departments.
It also benefits the rest of the organization. Bowties are an element of safety management. However, like any risk assessment tool, bowtie analysis has limitations. It is important to be aware of these limitations to ensure that bowtie diagrams are used effectively.
Advantages of bowtie:
- Establishing a common language of risk: Bowtie diagrams provide a common language for risk communication and show the result of risk assessment, including inherent and residual risk.
- Comprehensive risk analysis: Bowtie analysis provides a comprehensive overview of hazards, threats, top events, consequences, and barriers.
- Visual representation of risk: Bowtie diagrams provide a clear and easily digestible visual representation of risk, making it easier for staff and managers to understand how major accidents can occur and what barriers exist to prevent or mitigate them.
- Barrier-based risk management: Bowtie analysis is a barrier-based risk management tool that utilizes diagrams to visually represent and communicate the factors that contribute to risk.
- Valuable tool for hazard identification and education: Bowtie analysis is a valuable tool for educating personnel about hazard analysis and conducting hazard analysis.
Disadvantages of Bowtie
- In-depth knowledge required: Bowtie diagrams can require in-depth knowledge from subject matter experts for consistency in definitions and development methodology.
- Time-consuming: Developing a meaningful bowtie diagram may take considerable time.
- False sense of security: Barriers identified in bowtie diagrams may not be independent of each other, leading to a false sense of safety.
- Confusing threats: Bowtie diagrams can be confusing when threats are not clearly defined or when there are too many threats.
- Not a foolproof risk assessment tool: No risk assessment tool is foolproof, and bowtie analysis is no exception. It is important to remember that bowtie is just one of the possible methodologies to analyze risks.
Mastering Risk Management with Bowties in IMS SIS
At Cenosco, we know that developing effective risk management strategies for an organization can be challenging, especially as risks become more complex.
Effective risk communication is an essential component of any industrial safety program. In our application, bowtie diagrams enhance communication between functional safety engineers and the process safety department, leading to a safer industrial site.
To confidently navigate the complexities of risk management and safeguard your organization’s operations and objectives, it is important to embrace a fresh perspective and utilize powerful tools such as bowtie analysis. For that reason, our IMS SIS (Safety Instrumented System) tool utilizes the advantages of the bowtie diagram to visualize HAZOP analyses and existing LOPA studies.
In simple terms, the bowtie diagram in IMS SIS is a means of analyzing risk strategy. It helps you see potential hazards and their consequences clearly and visually, allowing you to plan and manage them effectively.
Discover the potential of bowtie analysis to revolutionize your risk management approach. Request a demo today and unlock the benefits of this powerful tool.
Request a Demo
Want to see IMS SIS and it’s bowtie capabilities in action? Fill out the form below to get started.