People often want to know how qualitative and quantitative risk assessments differ from each other. This is a good question in today’s world of digitalization where there are many different RBI (Risk-Based Inspection) software packages available.
Let’s rewind a little bit and first have a look at the risk assessment standards that are out there.
What standards are there?
There are several International engineering standards and recommended practices that outline requirements, methodologies, and the implementation of RBI. Examples are ASME PCC-3, RIMAP, DNV-RP G101, API 580, API 581, API 571, etc.
The different standards are often applied to specific sections of the industry. For example, ASME is an American standard specifically developed for fixed pressure-containing equipment; API is also an American standard that has been specifically developed for the oil and gas sector; and RIMAP is a European standard that’s more applicable to power plants.
People sometimes confuse the different types of recommended practices. For example, API 580 outlines requirements (e.g., conceptual approaches and necessary elements to be included in an RBI assessment), whereas API 581 outlines a methodology aligned with API 580. RBI software packages can thus be aligned with a best practice that outlines requirements (e.g., API 580), without implementing an associated methodology (e.g., API 581).
What do the standards recommend?
The standards typically do not recommend just one (e.g., only quantitative) approach. For example, API 580 gives guidance for RBI implementations, using either Level 1 (qualitative) or Level 2 (semi-quantitative), or Level 3 (quantitative) methods. (API 581 falls under the Level 3 RBI methods.)
However, what is typically recommended is that the RBI methodology and RBI team study method must be defendable, user-friendly, detailed, documented, transparent and auditable. For example, to be aligned with API 580, software should implement a user-friendly RBI methodology that the responsible plant inspection engineers and operations engineers fully understand. Otherwise, it can lead to an increase in equipment risk rather than a risk reduction.
The standards also emphasize that the RBI technology method (whether it is Level 1, Level 2 or Level 3) must be robust. The selected methodology must reliably assess the Probability of Failure and the Risk Profiles of each of the DMs / FMs (Degradation Methods / Failure Modes) applicable, otherwise, there cannot be confidence in the optimum inspection interval. Furthermore, the team study method must ensure the identification of all FMs, operating limits, maintenance activities, and other risk mitigation actions.
What are qualitative, semi-quantitative, and quantitative risk assessments?
So, now we know that qualitative, semi-quantitative, and quantitative risk assessment software can all be acceptable according to the standards, but what’s the difference then?
Let’s start by looking at the definitions. Quantitative data is designed to collect cold, hard facts. Numbers. Quantitative data is structured and statistical. Qualitative data collects information that seeks to describe a topic more than measure it. Think of impressions, opinions, and views. Semi-quantitative data has a bit of both. Some parts of the data are qualitative and other parts are quantitative
Thus, quantitative risk assessment methodologies give quantitative estimates of risks, given the parameters defining them. In contrast, in a qualitative assessment, probability and consequence are not numerically estimated but are evaluated verbally using qualifiers like high likelihood, low likelihood, etc.
If we now assume that reliable data is readily available, a full quantitative risk estimate should give the most precise and accurate results. Here, we must however note the following. The type of data to perform a good quantitative assessment is hard and time demanding to get, which often leads to data of less quality, which means less accurate results.
Accuracy is a function of analysis methodology, data quality, and consistency of execution. Precision is a function of the selected metrics and computational methods. So, we need to be careful when looking at risk assessments, since the result could be very precise, but if there is still a lot of uncertainty inherent within the probabilities and consequences, then the result is still not accurate.
What are the benefits and limitations of qualitative and quantitative RBI software?
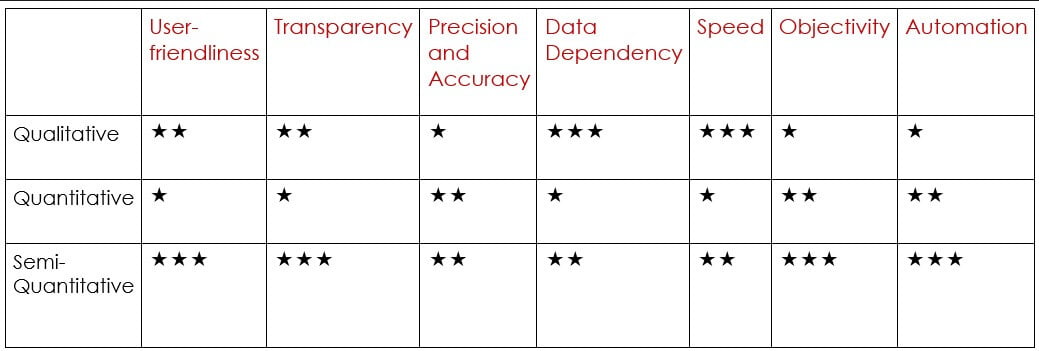
So, which is better then? There is no easy answer since qualitative, semi-quantitative, and quantitative risk assessments can all be successful. Let’s first try to compare typical qualitative and quantitative risk assessments:
- User-friendliness: This is probably the greatest benefit of qualitative analysis. These are typically easier to make user-friendly since they are less complex.
- Transparency: For the same reason a qualitative methodology is typically much easier to fully understand. Due to the complexity of the quantitative calculations, quantitative methods tend to be implemented as black boxes.
- Precision and Accuracy: If good data can be obtained quantitative methodologies should win this one, since they involve rigorous quantitative assessments of the PoF (Probability of Failure) and the CoF (Consequence of Failure) associated with each equipment item. We must just remember that the accuracy will depend on the inherent uncertainty in the probabilities and consequences.
- Data Dependency: A qualitative analysis requires less data.
- Speed: Since a qualitative RBI analysis requires less data, it is typically much faster. Gathering all the data for a quantitative RBI analysis can be hard and time-consuming.
- Objectivity: Results of a qualitative RBI analysis are heavily dependent on the team and their expertise in performing the analysis and thus more subjective. A quantitative analysis is more objective. However, one should not be fooled that a quantitative method is foolproof, for good results experienced RBI and inspection personnel are still needed.
- Automation: Since quantitative methods require less team input, they are easier to automate.

Best of both?
It is obvious that neither the qualitative nor the quantitative methodology is perfect. To increase the benefits and reduce the limitations, one can also go for the option of combining these two methods.
Hence, semi-quantitative risk assessment! This methodology tends to be easy to understand and user-friendly, but also more accurate. Of course, it must be supported by an experienced multi-discipline team study to ensure confidence in the results. One would then do a qualitative analysis in some sections of the risk assessment and in other sections (selected based on a confidence/sensitivity analysis) one would do a quantitative risk assessment.
Another approach to get the best of both would be to first do a (faster) high-level qualitative RBI analysis to select the high-risk facilities in one’s plant. Then one can do quantitative RBI analyses only on these high-risk facilities. Remember, for accurate results, good data and an experienced multi-discipline team study remains a requirement.
Explore the Right RBI Approach for Your Operations
At Cenosco, we understand that every asset strategy is unique – which is why we support a range of Risk-Based Inspection (RBI) methodologies, from qualitative to fully quantitative, aligned with API 580 and API 581 guidelines.
Our IMS (PEI) software has long supported the S-RBI methodology, a Shell-developed Risk-Based Approach, compliant to API 580 and to API 571’s damage mechanisms. This can be implemented as either qualitative or semi-quantitative. For the semi-quantitative methodologies, it uses specific calculators (e.g. liquid release, CUI, SSC, and other corrosion prediction models) and detailed questionnaires, to calculate StF (Susceptibility to Failure) and CoF (Consequence of Failure), based on the most relevant failure modes. When using the S-RBI methodology IMS PEI allows users to swap between methodologies for each RBI Analysis. The default is the semi-quantitative methodology since this is preferred by most customers.
Since 2025 we also provide comprehensive support for a fully quantitative API 581-based RBI methodology, specifically for pressure equipment such as piping, vessels, and tanks. Our flexible and standards-aligned approach ensures you can apply RBI effectively across a wide range of assets. Our implementation follows the 2016 edition of API 581, including the 2019 and 2020 addenda – offering a stable and trusted foundation. It includes features like configurable failure frequencies and interval target configurations.
Whether you’re just starting with RBI or refining an existing program, we can help you choose the approach that best suits your operations – be it qualitative, semi-quantitative, or fully quantitative in line with API 580/581.
Also, remember IMS PEI is not a standalone RBI tool. It integrates the RBI results with inspection results, wall thickness measurements/calculations, and schedules. The RBI results can thus be used to define the next inspection dates that feed into the IDMS part of the tool, which can, in turn, interface with the site’s CMMS (Computerized Maintenance Management Software) (e.g. SAP).
Ready for a Demo?
Are you ready to see the IMS Suite in action? Fill out the form below to book a demo!

Elsa Tolsma-de Klerk Technical Writer
Elsa is an engineer with a passion for sharing knowledge. She holds a Master’s in Electronic Engineering and spent over a decade at Sasol as an Advanced Process Control Engineer, where she gained hands-on experience in optimization, control systems, and writing technical documentation. Since 2019, she’s been a Technical Writer at Cenosco, now leading the IMS knowledge base and training Academy team.


